The SBA Analysis Tools
 I'm not sure how many people have noticed or played with this gem. The Analysis Tools are accessed off of the Windows Start menu and bring up a separate little application to launch each of the predefined Excel or Access components. Excel is used for pivot table functions and Access is used to render reports that users can easily customize using extended data from the SBA database. Unlike QuickBooks and other accounting apps, SBA lets users with the appropriate security rights access the data from within the other Office applications they may already be using today.
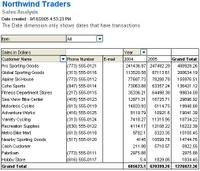
 In the case of Excel, the Analysis Tools provide two templates that take data from SBA and present it in a very
 useful pivot table -- leveraging the full capabilities of Excel. For instance, the Sales Analysis pivot table retrieves sales information from every customer across all fiscal years. Given this broad baseline, you can slice and dice the data to get the desired cut of the data. Options include filtering on customers, fiscal years or even down to best selling items. Finally, because it's Excel, you also get great charting capabilities. In this particular tool, the chart is predefined.
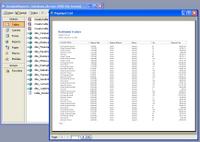
With Access, users are given a set of predefined reports that can be customized or combined with existing data from other applications to create new and meaningful reports. Often times, the hardest part about using Access to leverage
 data from another application is setting up the connection and security. I'm sure the goal here was to provide a number of examples of useful reports with the connection to the database and security all ready to go. Expanding on what is already there should be a piece of cake.
In addition to being able to modify these Analysis Tools to your heart's content, you also have the ability to add your own custom tools into the same interface using the Add button on the right.
Note, click on the images to enlarge.

0 Comments:
Post a Comment
<< Home